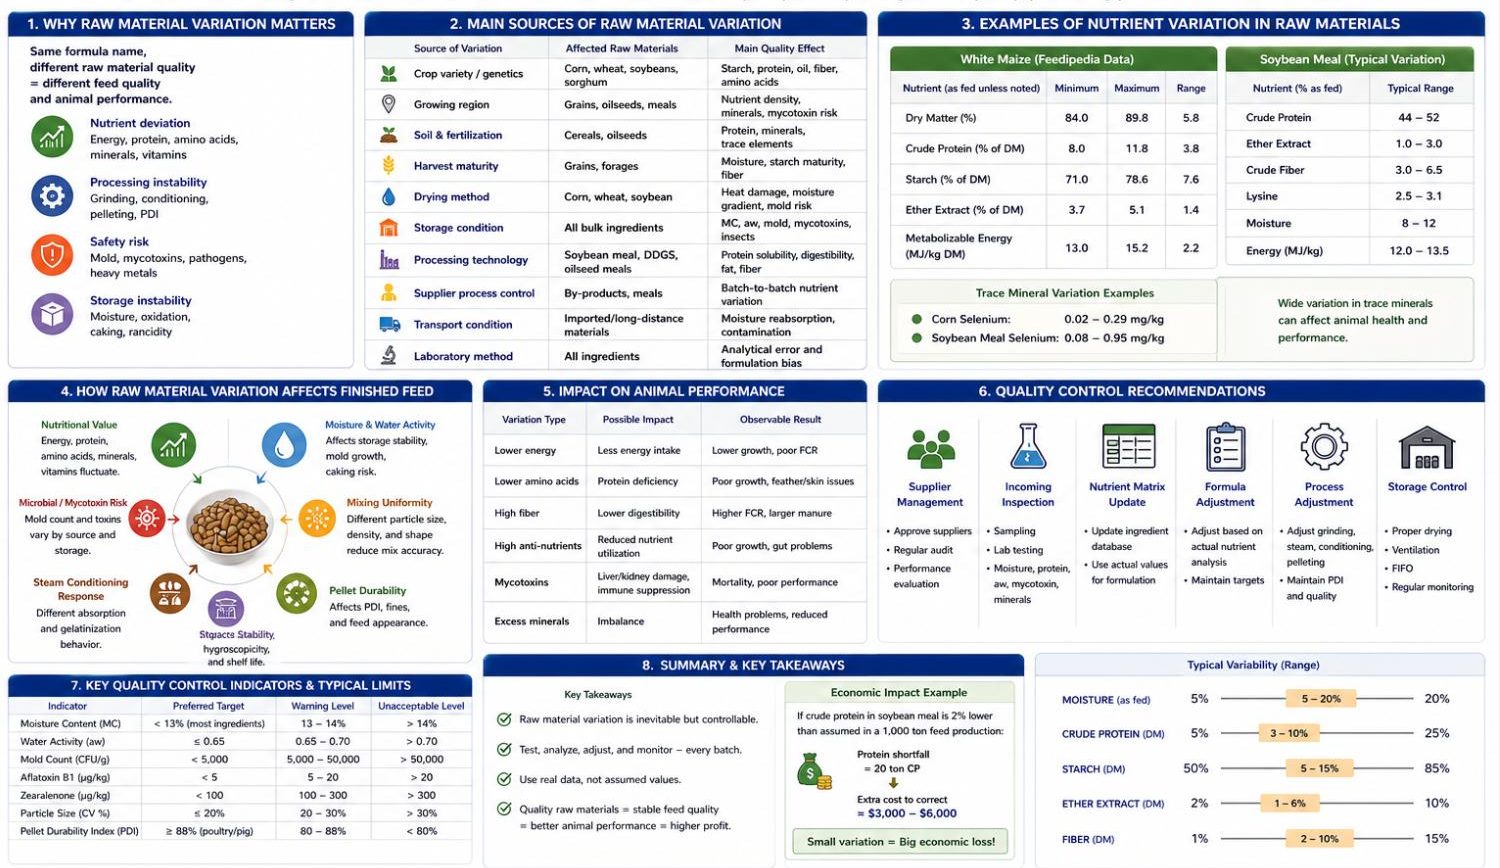
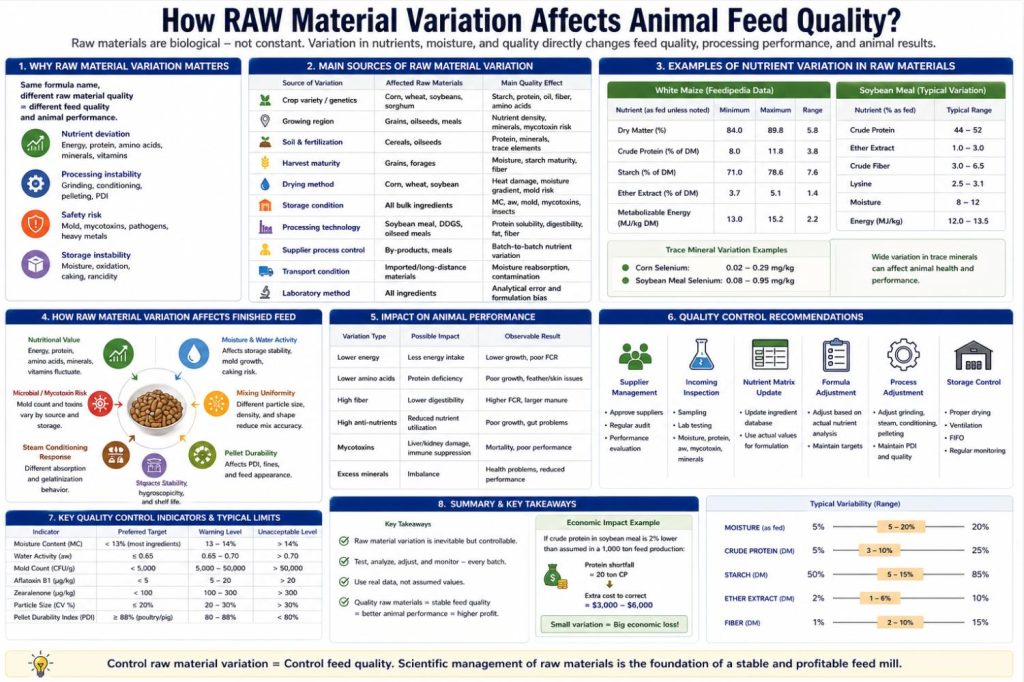
Raw material variation is one of the most important sources of instability in animal feed quality. Even when the same formula name is used, the actual nutrient value, processing behavior, pellet quality, storage stability, and animal performance of the finished feed may change significantly if the incoming raw materials vary in moisture, protein, starch, fiber, fat, amino acid digestibility, mineral content, particle hardness, microbial load, or mycotoxin contamination.
Feed ingredients are biological materials, not industrial chemicals. Corn, wheat, soybean meal, DDGS, rice bran, fish meal, meat and bone meal, vegetable oils, minerals, and by-products vary according to variety, growing region, soil condition, harvest maturity, drying method, storage time, processing technology, supplier, and transport environment.
FAO emphasizes that quality and safety assessment of feed materials requires proper sampling and analysis because analytical data and feed composition values can vary substantially between materials, laboratories, and methods.
The practical effect of raw material variation is large. Feedipedia data for white maize show dry matter ranging from 84.0% to 89.8% as fed, crude protein from 8.0% to 11.8% of DM, starch from 71.0% to 78.6% of DM, and ether extract from 3.7% to 5.1% of DM. These ranges are large enough to change metabolizable energy, amino acid balance, pelleting behavior, and final feed moisture if formulation and processing parameters are not adjusted.
Soybean meal also varies significantly. Recent research notes that soybean meal nutrient and energy content, protein quality indicators, and amino acid digestibility show considerable variability among sources, and that analytical variability between laboratories can introduce bias in ingredient valuation.
Corn and soybean meal analyses from different sources have also shown large mineral variation; one study reported selenium ranging from 0.02 to 0.29 mg/kg in corn and 0.08 to 0.95 mg/kg in soybean meal, demonstrating that trace mineral variation can be far wider than routine formulation values suggest.
This report analyses how raw material variation affects finished feed quality through eight major pathways: nutritional value, moisture and water activity, microbial and mycotoxin risk, grinding and particle size behavior, mixing uniformity, steam conditioning response, pellet durability, and storage stability. It also provides quantitative control limits and practical quality-control recommendations for feed mills.
1- Introduction
In commercial animal feed production, formula design is usually based on assumed nutrient values. A formulation system may use standard values for corn, soybean meal, wheat bran, DDGS, fish meal, oil, limestone, dicalcium phosphate, and premix. However, the raw materials received at the factory rarely match these standard values exactly.
This difference between “formulated value” and “actual value” is one of the most common hidden causes of feed quality variation.
Raw material variation affects feed quality in four major ways:
*- It changes nutrient supply, including energy, crude protein, digestible amino acids, calcium, phosphorus, sodium, fiber, and fat.
*- It changes processing behavior, including grinding efficiency, steam absorption, conditioning response, pellet mill load, die friction, and pellet durability.
*- It changes safety risk, including mold count, mycotoxin level, rancidity, heavy metals, pesticide residues, and microbial contamination.
*- It changes storage stability, especially through moisture content, water activity, fat oxidation, hygroscopicity, and packaging response.
The feed mill therefore cannot treat raw materials as constant inputs. A modern quality system should manage them as variable biological materials requiring intake inspection, laboratory testing, supplier classification, nutrient matrix updates, formulation correction, and process adjustment.
2- Main Sources of Raw Material Variation
Raw material variation begins before the material reaches the feed mill. It may originate at the field, drying plant, oilseed crusher, ethanol plant, rendering plant, storage silo, port warehouse, or transport vehicle.
Table 1. Main sources of raw material variation
| Source of variation | Affected raw materials | Main quality effect |
|---|---|---|
| Crop variety / genetics | corn, wheat, soybean, sorghum | starch, protein, oil, fiber, amino acids |
| Growing region | grains, oilseeds, meals | nutrient density, minerals, mycotoxin risk |
| Soil and fertilization | cereals, oilseeds | protein, minerals, trace elements |
| Harvest maturity | grains, forages | moisture, starch maturity, fiber |
| Drying method | corn, wheat, soybean | heat damage, moisture gradient, mold risk |
| Storage condition | all bulk ingredients | MC, aw, mold, mycotoxins, insects |
| Processing technology | soybean meal, DDGS, oilseed meals | protein solubility, digestibility, fat, fiber |
| Supplier process control | by-products, meals | batch-to-batch nutrient variation |
| Transport condition | imported or long-distance materials | moisture reabsorption, contamination |
| Laboratory method | all ingredients | analytical error and formulation bias |
Feed mills often focus on price differences between suppliers but underestimate the cost of quality variation. A low-cost ingredient may be expensive if its nutrient value is lower, moisture is higher, digestibility is poorer, or processing behavior reduces production efficiency.
3- Nutrient Variation and Formula Accuracy
The most direct effect of raw material variation is nutrient deviation. If the actual protein, amino acid, starch, fat, fiber, calcium, or phosphorus content differs from the formulation value, the finished feed may fail to meet nutritional targets.
This is especially important for high-performance poultry, piglet, aquaculture, dairy, and breeder feeds, where small nutrient deviations can affect growth rate, feed conversion ratio, egg production, milk yield, immunity, or reproductive performance.
Table 2. Example nutrient variation in maize grain
| Parameter | Reported range / value | Feed quality implication |
|---|---|---|
| Dry matter, white maize | 84.0–89.8% as fed | affects real nutrient concentration and storage risk |
| Crude protein, white maize | 8.0–11.8% DM | affects amino acid contribution |
| Starch, white maize | 71.0–78.6% DM | affects energy value and gelatinization |
| Ether extract, white maize | 3.7–5.1% DM | affects energy and oxidation risk |
| Crude fiber, white maize | 1.6–3.3% DM | affects digestibility and pellet quality |
| AMEn broiler, yellow maize | 14.7–15.1 MJ/kg DM | affects poultry energy formulation |
Feedipedia reports these maize composition ranges and provides variability statistics for feed materials, confirming that raw material nutrient values are not fixed constants.
A practical example illustrates the problem. If a feed formula assumes corn crude protein at 8.5% as fed, but the delivered corn is closer to 7.5%, a formula using 60% corn loses about 0.6 percentage points of crude protein contribution from corn alone. This may appear small, but it can reduce amino acid safety margins, especially when soybean meal inclusion is reduced for cost optimization.
4- Soybean Meal Variation and Amino Acid Risk
Soybean meal is the most important protein source in many poultry, pig, and aquaculture feeds. However, soybean meal quality varies by origin, processing condition, hull inclusion, residual oil level, protein solubility, fiber content, and heat treatment.
Soybean meal nutrient and energy content, protein quality indicators, and amino acid digestibility vary considerably among commercial sources. Analytical variability among laboratories can also affect feedstuff valuation.
Soybean meal evaluation should not rely only on crude protein. Crude protein does not fully indicate digestible lysine, methionine, threonine, tryptophan, protein damage, urease activity, KOH solubility, or antinutritional factors.
Table 3. Key soybean meal variation factors
| Quality factor | Technical significance | Effect on finished feed |
|---|---|---|
| Crude protein | total nitrogen-based protein estimate | affects formula protein level |
| Digestible lysine | first-limiting amino acid in many diets | affects growth and FCR |
| KOH protein solubility | heat damage indicator | low value indicates over-processing |
| Urease activity | under-processing indicator | high value indicates residual antinutritional risk |
| Trypsin inhibitor activity | antinutritional factor | reduces protein digestion |
| Crude fiber | hull inclusion indicator | reduces energy density |
| Residual oil | energy contribution | affects ME and pellet behavior |
| Moisture | storage and formulation basis | affects actual nutrient density |
| Origin | processing and composition pattern | affects matrix value |
For amino acid prediction, a study developing equations for soybean meal amino acids reported that predicted lysine in soybean meal can be modeled from crude protein, but the lysine equation had R² = 0.51, indicating that crude protein explains only part of lysine variation. This means a high crude protein soybean meal does not automatically guarantee proportionally high digestible lysine.
Table 4. Practical soybean meal QC targets
| Parameter | Common technical target / interpretation | Risk if abnormal |
|---|---|---|
| Moisture | usually around 11–13% depending supplier | mold, caking, lower dry matter |
| Crude protein | often 44–48% as fed depending grade | formula protein deviation |
| Urease activity | low but not zero | too high = underprocessed |
| KOH solubility | moderate-high desirable | too low = heat damage |
| Crude fiber | lower is usually better | high hulls reduce energy |
| Trypsin inhibitor | low after proper heating | poor protein digestion |
| Lysine digestibility | formulation-critical | animal performance loss |
5- Moisture Variation and Its Effect on Feed Quality
Moisture variation affects feed quality in two ways. First, it changes nutrient concentration on an as-fed basis. Second, it changes processing and storage behavior.
A raw material with 14% moisture contains less dry matter per tonne than the same material at 11% moisture. If formulation is not corrected to dry matter basis, the feed mill may unknowingly dilute nutrient density.
Table 5. Effect of raw material moisture on dry matter value
| Ingredient moisture | Dry matter per 1,000 kg | Difference vs. 11% MC |
|---|---|---|
| 10% | 900 kg | +10 kg |
| 11% | 890 kg | baseline |
| 12% | 880 kg | -10 kg |
| 13% | 870 kg | -20 kg |
| 14% | 860 kg | -30 kg |
| 15% | 850 kg | -40 kg |
If a mill buys 1,000 tonnes of corn at 14% moisture instead of 11%, it receives 30 tonnes less dry matter. This is not only a storage risk; it is also a real economic and nutritional loss if pricing and formulation do not adjust for moisture.
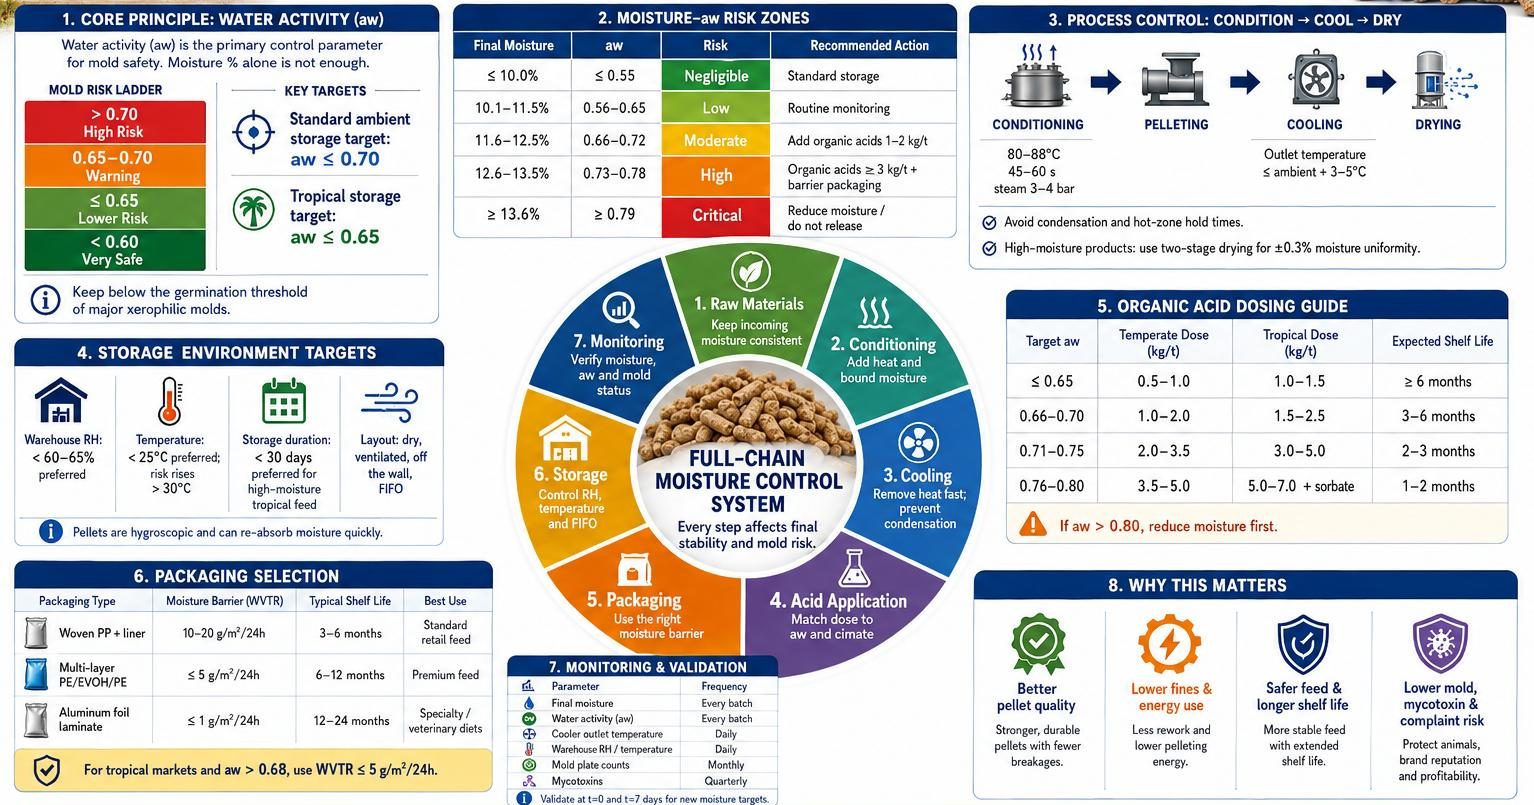
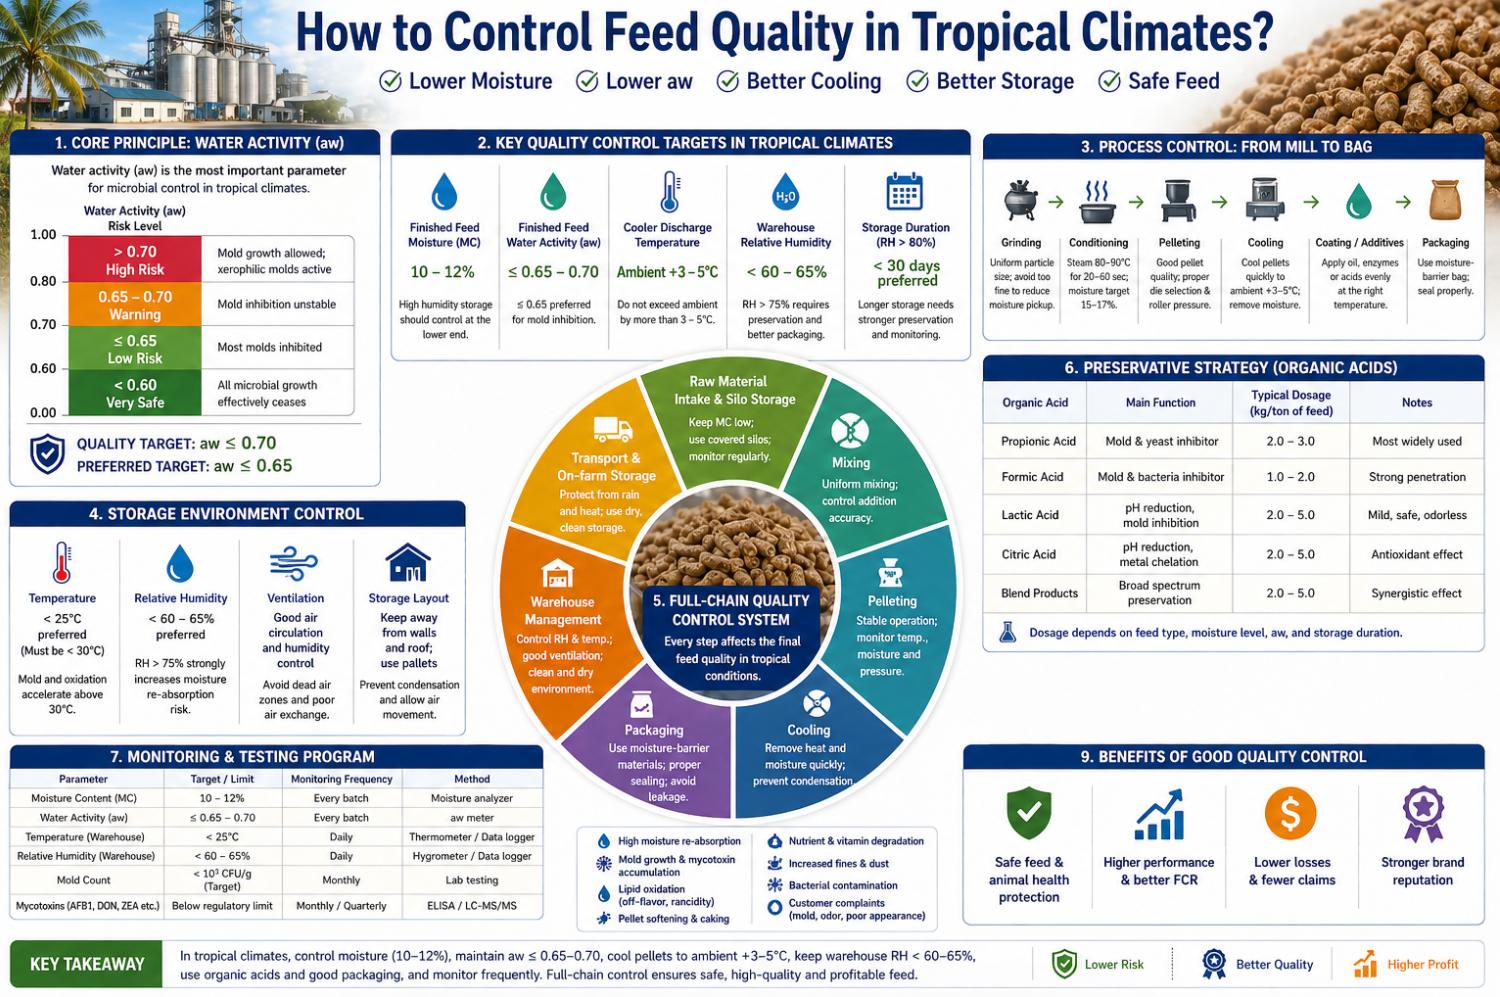
FAO mycotoxin prevention guidance states that after harvest, produce should be dried to 12–14% moisture wet basis for safer storage with minimal deterioration. For feed mills, this supports the principle that raw material moisture above this range should trigger risk control, especially in warm or humid climates.
Table 6. Moisture-related raw material risk classification
| Raw material MC | Risk level | Feed mill action |
|---|---|---|
| <10% | low microbial risk, possible dust/brittleness | normal use; watch grinding dust |
| 10–12% | preferred for many dry materials | normal storage and formulation |
| 12–14% | acceptable with control | monitor storage time and aw |
| 14–16% | elevated risk | rapid use, aeration, mold testing |
| >16% | high risk | dry, reject, segregate, or preserve |
Moisture variation also affects grinding. Wet materials can reduce grinding efficiency, increase energy consumption, and cause screen plugging. Over-dry materials may create excessive dust and poor pelleting behavior.
6- Water Activity, Mold, and Mycotoxin Risk
Raw material variation is not only nutritional. It also affects feed safety. Corn, wheat, barley, sorghum, groundnut meal, cottonseed meal, DDGS, rice bran, and oilseed meals may carry mold spores or mycotoxins before entering the feed mill.
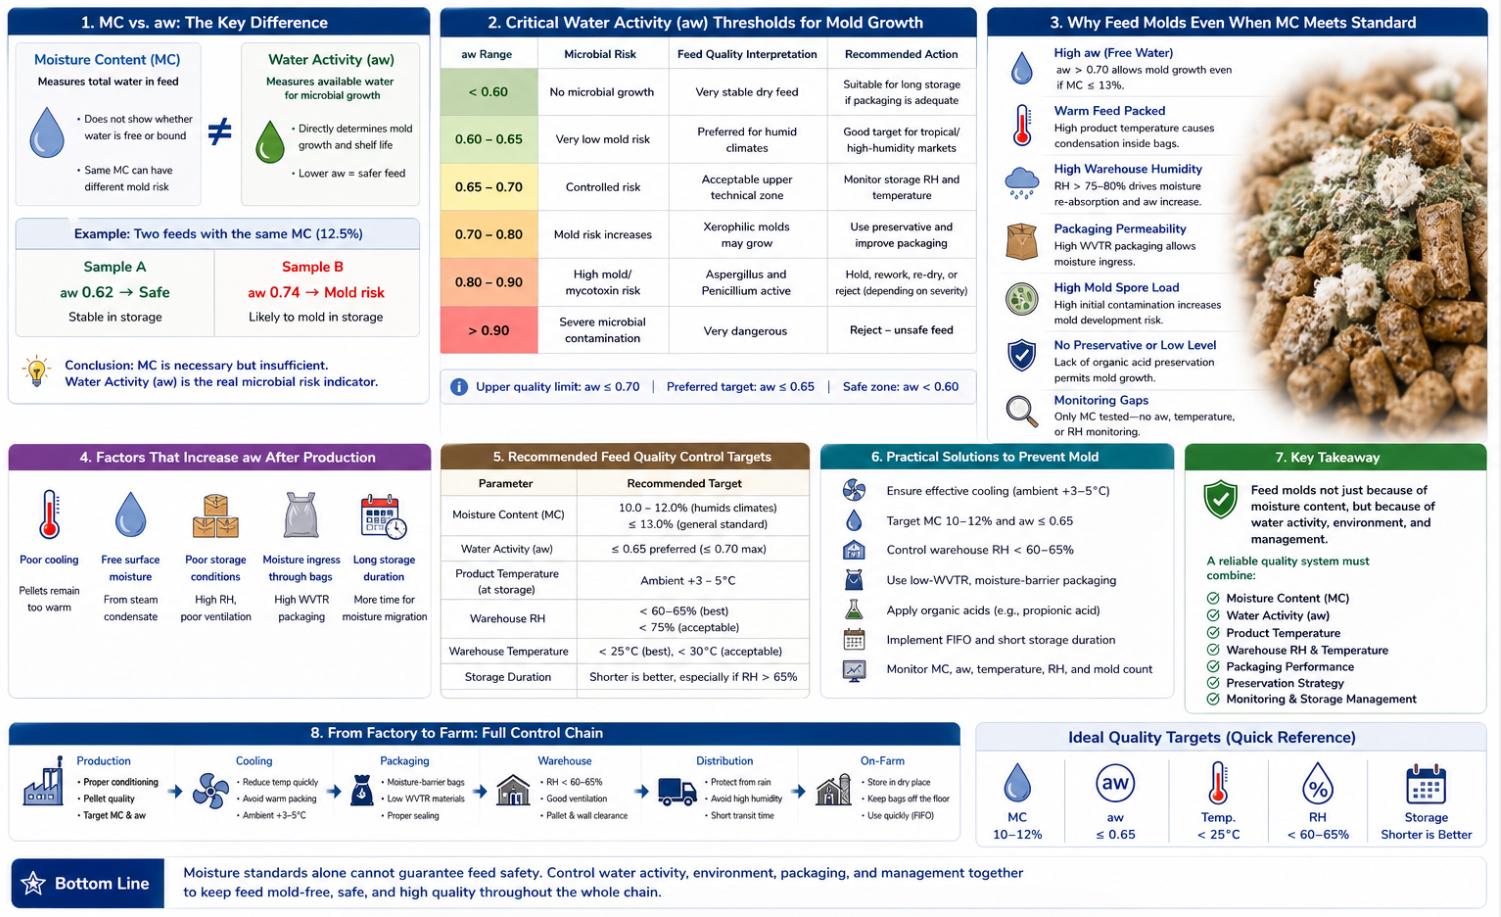
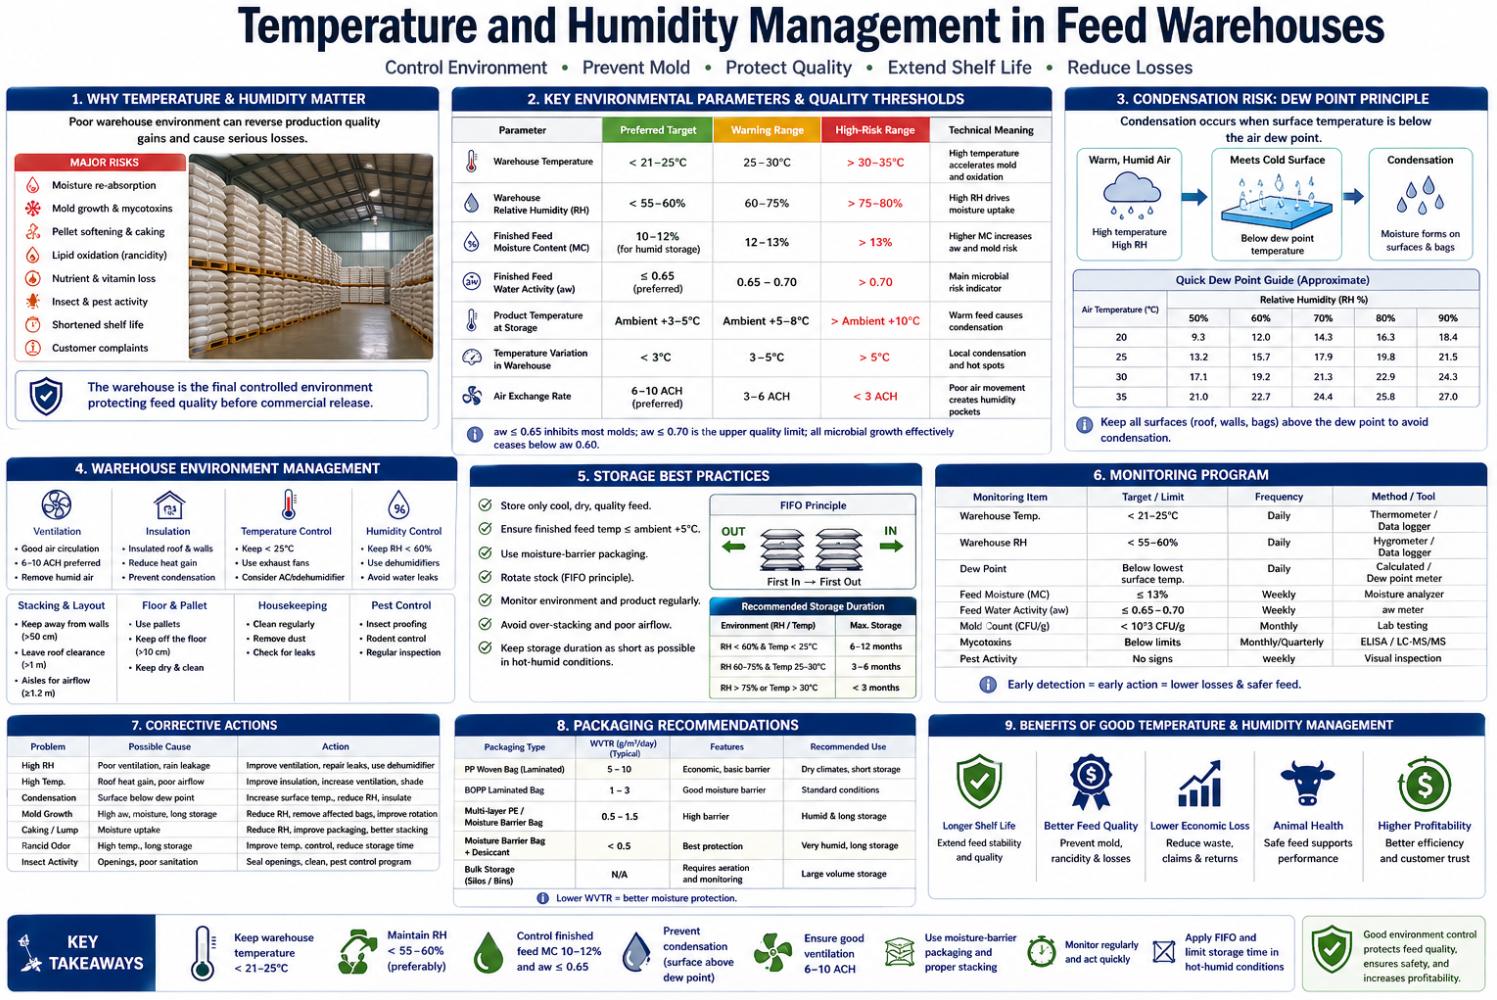
FAO notes that fungal growth and aflatoxin production are associated with high moisture, humid climate, warm temperatures around 25–40°C, insect infestation, and pest damage. Another FAO storage reference states that storage fungi require about 65% relative humidity, equivalent to aw = 0.65, and grow over a broad temperature range of approximately 10–40°C.
A five-year survey of feed and raw materials in China analyzed 9,392 samples from 2017 to 2021 for aflatoxins, zearalenone, trichothecenes type B, and fumonisins, demonstrating the practical need for routine multi-mycotoxin monitoring in feed raw materials.
Table 7. Raw material mycotoxin risk by ingredient
| Ingredient | Main mycotoxin concern | Risk driver |
|---|---|---|
| Corn / maize | aflatoxins, fumonisins, DON, ZEA | field mold, storage humidity |
| Wheat | DON, ZEA, OTA | Fusarium and storage mold |
| Barley | DON, OTA | field and storage contamination |
| DDGS | concentrated corn mycotoxins | ethanol co-product concentration |
| Groundnut meal | aflatoxin | high-risk oilseed material |
| Cottonseed meal | aflatoxin, gossypol | field/storage contamination |
| Rice bran | mold and rancidity | high fat and moisture sensitivity |
| Fish meal | microbial load, rancidity | storage and oxidation |
| Silage-type materials | OTA, yeast, mold | fermentation/storage conditions |
Table 8. Practical mycotoxin control strategy
| Risk level | Raw material condition | Recommended action |
|---|---|---|
| Low | dry, clean, known supplier | routine sampling |
| Moderate | seasonal humidity, uncertain origin | batch testing for key toxins |
| High | visible mold, high moisture, hot material | hold, test, segregate |
| Very high | toxin-positive or moldy lot | reject or use only under strict legal limits |
| Chronic risk | repeated supplier issue | supplier downgrade or removal |
Mycotoxins are especially problematic because they may remain in the ingredient even after visible mold is no longer active. Heat treatment and pelleting do not reliably destroy most mycotoxins.
7- Protein and Energy Variation: Effect on Animal Performance
When raw materials vary, the finished feed may no longer match its intended nutrient specification. This can affect feed conversion ratio, growth rate, egg mass, milk production, immune status, and carcass yield.
Table 9. Example effects of nutrient deviation
| Raw material variation | Finished feed effect | Animal performance risk |
|---|---|---|
| Corn starch lower than expected | ME lower than formulated | higher FCR, slower gain |
| Soybean meal lysine lower than expected | digestible lysine deficiency | lower growth, poor lean gain |
| DDGS fiber higher than expected | lower energy, poorer pellets | lower digestibility |
| Fish meal protein lower / ash higher | lower amino acid density | poor aquatic feed performance |
| Oil quality poor | rancidity, lower energy value | lower palatability |
| Limestone calcium variable | Ca:P imbalance | bone, eggshell, urinary issues |
| MCP/DCP phosphorus variation | available P deviation | bone mineralization risk |
| Salt/sodium variation | electrolyte imbalance | intake and litter issues |
NRC nutrient requirement reports are widely used as authoritative references for animal nutrient requirements, but accurate formulation depends on the actual nutrient values of ingredients used in the mill. Therefore, even the best formulation model cannot correct poor input data.
8- Variation in Fiber and By-Products
By-products such as DDGS, wheat bran, rice bran, palm kernel meal, sunflower meal, corn gluten feed, and bakery meal often show greater variability than primary grains. Their composition depends heavily on upstream processing.
DDGS is a clear example. A study of corn DDGS from 8 U.S. ethanol suppliers evaluated proximate analysis, starch, sugars, minerals, AMEn, amino acid digestibility, particle size, and color. The study noted that crude protein and ash showed lower variability than crude fat and crude fiber across laboratories and suppliers.
Table 10. By-product variation and feed quality risk
| By-product | Common variation | Feed quality effect |
|---|---|---|
| DDGS | fat, fiber, color, mycotoxins | energy, digestibility, pellet quality |
| Wheat bran | fiber, particle size | lower pellet density, higher die friction |
| Rice bran | fat, rancidity, moisture | oxidation and mold risk |
| Palm kernel meal | fiber, shell contamination | lower digestibility and PDI |
| Sunflower meal | hull content, fiber | lower energy and pellet strength |
| Bakery meal | sugar, fat, salt | variable energy and caking |
| Corn gluten feed | fiber and moisture | variable digestibility |
| Fish meal | protein, ash, TVN, histamine | palatability and safety risk |
High-fiber ingredients often reduce pellet durability and increase pellet mill load because fiber is elastic, bulky, and less adhesive. They may require finer grinding, longer conditioning, higher moisture control, or different die compression.
9- Raw Material Variation and Grinding Behavior
Grinding performance depends on raw material hardness, moisture, oil content, fiber level, and particle structure. Two batches of corn with similar nutrient analysis may grind differently if kernel hardness differs.
Hard corn may require more energy and produce more coarse particles. Soft corn may grind more easily but can produce more fines and may be more vulnerable to storage mold. Particle size variation affects both nutrient digestibility and pellet quality.
Table 11. Raw material properties affecting grinding
| Raw material property | Grinding effect | Downstream feed effect |
|---|---|---|
| High moisture | screen plugging, lower efficiency | inconsistent particle size |
| Very low moisture | more dust | higher fines and explosion/dust risk |
| High oil | screen coating | uneven grind and poor flow |
| High fiber | difficult size reduction | lower pellet density |
| Hard kernels | higher energy use | coarse particles if not controlled |
| Soft kernels | easier grinding | more fines and dust |
| Foreign material | hammer/screen damage | contamination and equipment wear |
Particle size must be controlled because it affects mixing, conditioning, pellet durability, digestibility, and animal gut function. For pellet feed, oversize particles can become fracture points inside pellets.
10- Raw Material Variation and Mixing Uniformity
Raw materials differ in bulk density, particle size, flowability, electrostatic behavior, oil content, and moisture absorption. These differences affect mixing uniformity and segregation.
Table 12. Raw material physical variation and mixing effect
| Physical property | Example material | Feed quality risk |
|---|---|---|
| High bulk density | minerals, limestone, salt | segregation if mixing poor |
| Low bulk density | bran, hulls, fiber meals | poor flow and volume error |
| Fine powder | premix, amino acids | dust loss and uneven distribution |
| Coarse particles | cracked grain, coarse bran | segregation after mixing |
| Sticky material | molasses, high moisture meal | mixer buildup |
| Oily material | rice bran, full-fat soybean | flow and coating issues |
| Hygroscopic material | salt, some minerals | caking and moisture uptake |
Mixing variation is especially dangerous for micro-ingredients such as vitamins, trace minerals, enzymes, medications, coccidiostats, and amino acids. If raw material flowability changes, the coefficient of variation of the finished feed may increase even when mixer time remains unchanged.
11- Raw Material Variation and Steam Conditioning Response
Steam conditioning depends on the ability of mash feed to absorb heat and moisture. Raw material variation changes this response.
A feed mash containing more starch may respond well to steam conditioning because starch can gelatinize and bind particles. A mash high in fat may resist steam absorption because fat coats particle surfaces. A high-fiber mash may absorb moisture slowly and require longer retention time.
Research on pellet manufacturing of fibrous co-products notes that feed mashes capable of rapidly sorbing moisture were expected to produce higher quality pellets because moisture diffusion contributes to particle bond formation and feed deformability.
Table 13. Raw material effects on conditioning
| Raw material variation | Conditioning effect | Pellet quality effect |
|---|---|---|
| Higher starch | better gelatinization potential | improved PDI |
| Higher fat | lower water penetration | weaker pellets |
| Higher fiber | slower moisture absorption | more die friction |
| Higher moisture | less steam needed | risk of over-wetting |
| Lower moisture | more steam/water demand | brittle pellets if not corrected |
| Coarse particles | slow heat/moisture transfer | uneven conditioning |
| High sugar/molasses | stickiness | buildup risk |
| High mineral ash | less binding | die wear and weak pellets |
This means that steam settings should not be fixed only by formula name. If incoming raw material moisture, fiber, or fat changes, conditioning temperature, steam flow, water addition, and retention time may need adjustment.
12- Raw Material Variation and Pellet Durability
Pellet durability is affected by formulation and raw material properties. Starch-rich ingredients usually improve pellet binding. Excess fat, high fiber, coarse particles, and poor moisture absorption usually reduce pellet quality.
A 2024 study on pellet manufacturing of livestock feed with fibrous co-products found that ingredient physicochemical characteristics affect feed mash behavior and pellet manufacturing, especially as co-product inclusion increases.
Table 14. Raw material factors affecting Pellet Durability Index
| Raw material factor | Effect on PDI | Technical reason |
|---|---|---|
| High starch | positive | starch gelatinization and bonding |
| Wheat inclusion | often positive | gluten and starch improve binding |
| High corn hardness | variable | grinding difficulty and coarse particles |
| Excess oil/fat | negative | reduces steam absorption and die friction |
| High crude fiber | negative | elastic structure and poor compaction |
| Fine particle size | positive up to optimum | more contact points |
| High mineral ash | negative/variable | poor binding and die wear |
| Molasses controlled | positive | binding effect |
| DDGS high inclusion | variable/negative | fiber, fat, particle variability |
A practical example: if a broiler feed formula changes from low-fiber soybean meal to a higher-fiber soybean meal or adds more DDGS, PDI may decline even if the formulation software still meets crude protein and energy targets. The physical pelletability of the formula has changed.
13- Raw Material Variation and Feed Safety
Feed raw material variation also affects chemical and biological safety. Hazards include mycotoxins, Salmonella, heavy metals, pesticide residues, dioxins, rancidity, and foreign material.
FAO and IFIF’s Good Practices for the Feed Sector were developed to help implement Codex good animal feeding practices and improve feed safety and quality at production level. Codex also emphasizes that good animal feeding is important for animal health, welfare, and production of safe food of animal origin.
Table 15. Raw material safety risks
| Hazard | High-risk materials | Quality consequence |
|---|---|---|
| Aflatoxin | corn, groundnut meal, cottonseed meal | liver damage, legal risk |
| DON | wheat, corn | reduced intake, pig sensitivity |
| ZEA | corn, wheat | reproductive effects |
| Fumonisins | corn, DDGS | species-specific toxicity |
| Salmonella | animal protein meals, oilseed meals | feed safety risk |
| Rancidity | oils, rice bran, fish meal | palatability loss |
| Heavy metals | mineral sources, fish meal | regulatory risk |
| Dioxins/PCBs | some fats, mineral sources | food chain risk |
| Foreign material | grains, by-products | equipment damage and contamination |
| Pesticide residues | grains, oilseeds | compliance risk |
Feed safety control starts at raw material approval. Finished feed testing alone may be too late if contaminated ingredients have already entered production.
14- Economic Impact of Raw Material Variation
Raw material variation has both direct and hidden economic costs. Direct costs include dry matter loss, nutrient under-supply, rejected batches, and rework. Hidden costs include poor animal performance, higher FCR, pellet mill energy loss, customer complaints, and brand damage.
Table 16. Economic impact examples
| Variation event | Example calculation | Economic meaning |
|---|---|---|
| Corn moisture 14% instead of 11% | 30 kg less DM per tonne | buyer pays for water instead of nutrients |
| Soybean meal CP 1% lower | 300 kg SBM/t formula contributes less protein | amino acid or protein correction needed |
| Fines increase from 5% to 10% | 50 kg/t extra fines | more rework and customer complaints |
| Mycotoxin-positive lot | entire batch may be downgraded | disposal or restricted use |
| Oil rancidity | poor intake and odor complaint | rejected feed risk |
| High-fiber by-product | lower pellet throughput | higher cost per tonne |
Table 17. Dry matter value loss from moisture variation
| Ingredient purchase volume | Moisture difference | Dry matter loss | Commercial implication |
|---|---|---|---|
| 1,000 t | 14% vs. 11% | 30 t DM | major nutrient/value loss |
| 5,000 t | 14% vs. 11% | 150 t DM | affects monthly cost |
| 20,000 t | 14% vs. 11% | 600 t DM | supplier valuation required |
| 100,000 t | 14% vs. 11% | 3,000 t DM | strategic procurement issue |
Raw material valuation should therefore use nutrient-adjusted cost, not only price per tonne.
15- Recommended Raw Material Quality Control System
A modern feed mill should use a risk-based raw material QC system. High-volume or high-risk ingredients should receive more frequent testing than low-risk materials.
Table 18. Recommended incoming raw material tests
| Raw material group | Routine tests | Risk-based tests |
|---|---|---|
| Corn / wheat / sorghum | MC, test weight, impurities, odor | mycotoxins, starch, protein, hardness |
| Soybean meal | MC, CP, fiber, urease | KOH solubility, amino acids, trypsin inhibitor |
| DDGS | MC, CP, fat, fiber, color | mycotoxins, digestible AA, sulfur |
| Rice bran | MC, fat, rancidity | peroxide value, acid value |
| Fish meal | CP, ash, moisture | TVN, histamine, Salmonella |
| Meat/bone meal | CP, ash, fat, moisture | digestibility, Salmonella, heavy metals |
| Oils/fats | moisture, impurities | peroxide value, acid value, MIU |
| Minerals | purity, particle size | heavy metals, solubility |
| Premix | label verification | vitamin potency, micro uniformity |
Table 19. Testing frequency by risk level
| Ingredient risk | Example ingredients | Recommended frequency |
|---|---|---|
| Low | limestone from approved supplier | periodic verification |
| Medium | wheat bran, standard grains | each lot for MC; periodic nutrient test |
| High | corn, DDGS, soybean meal | each lot MC + routine nutrient; mycotoxin risk-based |
| Very high | groundnut meal, fish meal, animal protein | each lot safety and nutrient testing |
| Seasonal risk | new crop corn, rainy-season materials | increased sampling and mycotoxin screening |
| New supplier | any ingredient | full qualification testing |
16- Use of NIR and Rapid Testing
Near-infrared spectroscopy is widely used for rapid evaluation of raw materials. FAO feed evaluation guidance notes the development and potential of near-infrared reflectance spectroscopy for whole-sample analysis and prediction.
NIR is valuable because it allows fast testing of moisture, crude protein, fat, fiber, starch, and sometimes amino acid prediction. However, it must be calibrated with reliable wet chemistry data.
Table 20. Practical raw material testing technologies
| Technology | Best use | Strength | Limitation |
|---|---|---|---|
| NIR | rapid nutrient screening | fast, non-destructive | requires calibration |
| Wet chemistry | reference analysis | accurate | slower and costly |
| Mycotoxin ELISA/strip | risk screening | fast decision support | confirmatory testing may be needed |
| HPLC/LC-MS/MS | mycotoxin confirmation | high accuracy | expensive |
| Moisture meter | intake moisture | fast | calibration needed |
| Sieve analysis | particle size | practical processing control | labor-intensive |
| PV/AV testing | oil/fat quality | oxidation control | requires chemical procedure |
| Microbiology | mold/Salmonella | safety verification | time-consuming |
The best system combines rapid screening with periodic reference analysis.
17- Supplier Classification and Ingredient Matrix Management
Raw material variation should be managed by supplier and origin. A feed mill should not use one universal soybean meal matrix or corn matrix if suppliers consistently differ.
Table 21. Supplier classification model
| Supplier grade | Quality performance | Procurement decision |
|---|---|---|
| A | stable nutrient values, low rejection, good documentation | preferred supplier |
| B | acceptable but variable | use with increased testing |
| C | frequent variation or documentation gaps | limited use, lower price required |
| D | safety issues or repeated rejection | suspend or remove |
Table 22. Ingredient matrix update triggers
| Trigger | Required action |
|---|---|
| new crop season | update corn/wheat nutrient matrix |
| new supplier | full nutrient and safety evaluation |
| CP deviation >1 percentage point | review formulation matrix |
| moisture deviation >2 points | dry matter and storage correction |
| mycotoxin detection | risk-based inclusion limit |
| PDI decline after ingredient change | review physical pelletability |
| energy or FCR complaint | review actual ME and digestible AA |
| soybean meal origin change | check amino acid and protein quality |
| DDGS supplier change | check fat, fiber, color, mycotoxins |
18- Process Adjustment Based on Raw Material Variation
Raw material QC should not stop at formulation. It should also guide production settings.
Table 23. Raw material variation and process adjustment
| Variation detected | Formulation action | Production action |
|---|---|---|
| Corn moisture high | adjust dry matter basis | shorten storage, monitor mold |
| Corn protein low | adjust amino acid contribution | no direct process change |
| Corn hard/coarse | check grind matrix | reduce hammer screen size |
| Soybean meal over-heated | reduce digestibility value | consider supplier rejection |
| Soybean meal high fiber | adjust energy | improve grinding/conditioning |
| DDGS high fat | adjust ME and fat | monitor pellet durability |
| DDGS high fiber | adjust energy | increase conditioning/die control |
| Raw material aw high | storage risk adjustment | rapid use or preserve |
| Oil PV high | reduce use/reject | antioxidant review |
| High fines raw material | adjust handling | dust control and mixing check |
19- Example Case: Corn Variation Causing Feed Quality Drift
A poultry feed mill formulates broiler feed using corn assumed to contain 8.5% crude protein, 72% starch, and 12% moisture. A new corn lot arrives with 14% moisture, lower starch, and harder kernels. The formula is not updated.
Table 24. Case diagnosis
| Parameter | Formula assumption | Actual corn lot | Effect |
|---|---|---|---|
| Moisture | 12% | 14% | less dry matter per tonne |
| Crude protein | 8.5% | 7.8% | lower protein contribution |
| Starch | 72% | 69% | lower energy and gelatinization |
| Kernel hardness | normal | high | coarser grind |
| Mold risk | low | moderate | higher storage monitoring needed |
| Particle size after grinding | 700 μm target | 950 μm actual | lower pellet quality |
| Finished PDI | 90% target | 85–87% actual | customer fines complaint |
Table 25. Corrective action
| Problem | Corrective action |
|---|---|
| High moisture | adjust formulation on dry matter basis |
| Lower protein/starch | update nutrient matrix |
| Hard kernels | reduce screen size or adjust hammer settings |
| Lower PDI | improve particle size and conditioning |
| Storage risk | use lot quickly or test aw/mycotoxins |
| Supplier issue | record lot performance and update supplier score |
This case shows that nutrient variation and process variation often occur together. The same raw material change affects both nutrition and pellet quality.
20- Example Case: Soybean Meal Variation Causing Amino Acid Risk
A pig feed plant uses soybean meal assumed to contain 46% crude protein. A new supplier provides soybean meal with similar CP but lower digestible lysine due to heat damage. The feed meets crude protein specification but pigs show poorer growth.
Table 26. Case diagnosis
| Parameter | Standard assumption | New SBM | Feed quality risk |
|---|---|---|---|
| Crude protein | 46% | 46% | appears normal |
| KOH solubility | normal | low | over-heating suspected |
| Lysine digestibility | normal | lower | growth performance risk |
| Urease | acceptable | low | confirms heat exposure |
| Feed CP | meets spec | meets spec | crude protein hides issue |
| Animal response | expected | lower gain | digestible AA deficiency |
Technical conclusion
Crude protein is not sufficient for soybean meal valuation. Digestible amino acids and protein quality indicators are required for precision feeding.
21- Final Technical Recommendations
1- Raw material variation should be treated as a primary feed quality risk, not an occasional purchasing issue.
2- Formulation should be based on actual or supplier-specific nutrient matrices, not only book values.
3- Moisture variation must be corrected on dry matter basis. A difference between 11% and 14% moisture represents 30 kg dry matter per tonne.
4- Corn and other cereals should be tested for moisture, protein, starch or energy indicators, mycotoxins, test weight, and particle behavior.
5- Soybean meal should be evaluated by crude protein, fiber, moisture, urease activity, KOH solubility, digestible amino acids, and origin.
6- DDGS and by-products require special control because fat, fiber, color, digestibility, and mycotoxin levels may vary widely among suppliers.
7- Raw material moisture should be managed together with aw and storage conditions, especially when materials exceed 14% moisture or are stored in warm, humid climates.
8- Mycotoxin testing should be risk-based and intensified for corn, wheat, DDGS, groundnut meal, cottonseed meal, and new-crop or rainy-season materials.
9- Processing parameters should change when raw material physical characteristics change. Grinding, conditioning, die selection, and cooling should not remain fixed when material behavior changes.
10- NIR testing should be used for rapid intake control, but NIR calibration must be verified by wet chemistry.
11- Supplier classification should include nutrient consistency, safety record, moisture stability, process behavior, complaint rate, and documentation quality.
12- Finished feed quality problems should be traced back to raw material lots. PDI, moisture, aw, animal performance, and complaint data should be linked to ingredient batches.
Conclusion
Raw material variation affects animal feed quality through nutrition, processing, safety, and storage stability. A feed formula may appear correct on paper, but if incoming ingredients differ from the assumed matrix, the finished feed may fail in crude protein, digestible amino acids, energy, pellet durability, moisture stability, or microbial safety.
The most important technical lesson is that feed quality is not created only in the mixer or pellet mill. It begins at raw material procurement and intake control. Corn moisture, soybean meal digestibility, DDGS fiber, oil rancidity, mycotoxin contamination, particle hardness, and mineral purity all influence final feed quality.
A modern feed mill should therefore build a raw-material-driven quality system. This system should include supplier qualification, lot-based sampling, rapid NIR screening, wet chemistry verification, mycotoxin testing, dry matter correction, ingredient matrix updates, and process parameter adjustment. Under this system, raw material variation is not merely detected after problems occur; it is anticipated, quantified, and controlled before it becomes a finished feed quality failure.