Finished animal feed may still develop mold even when its measured moisture content meets the factory or national standard. This quality failure is common in feed mills, especially in tropical, subtropical, rainy-season, coastal, or poorly ventilated storage environments.
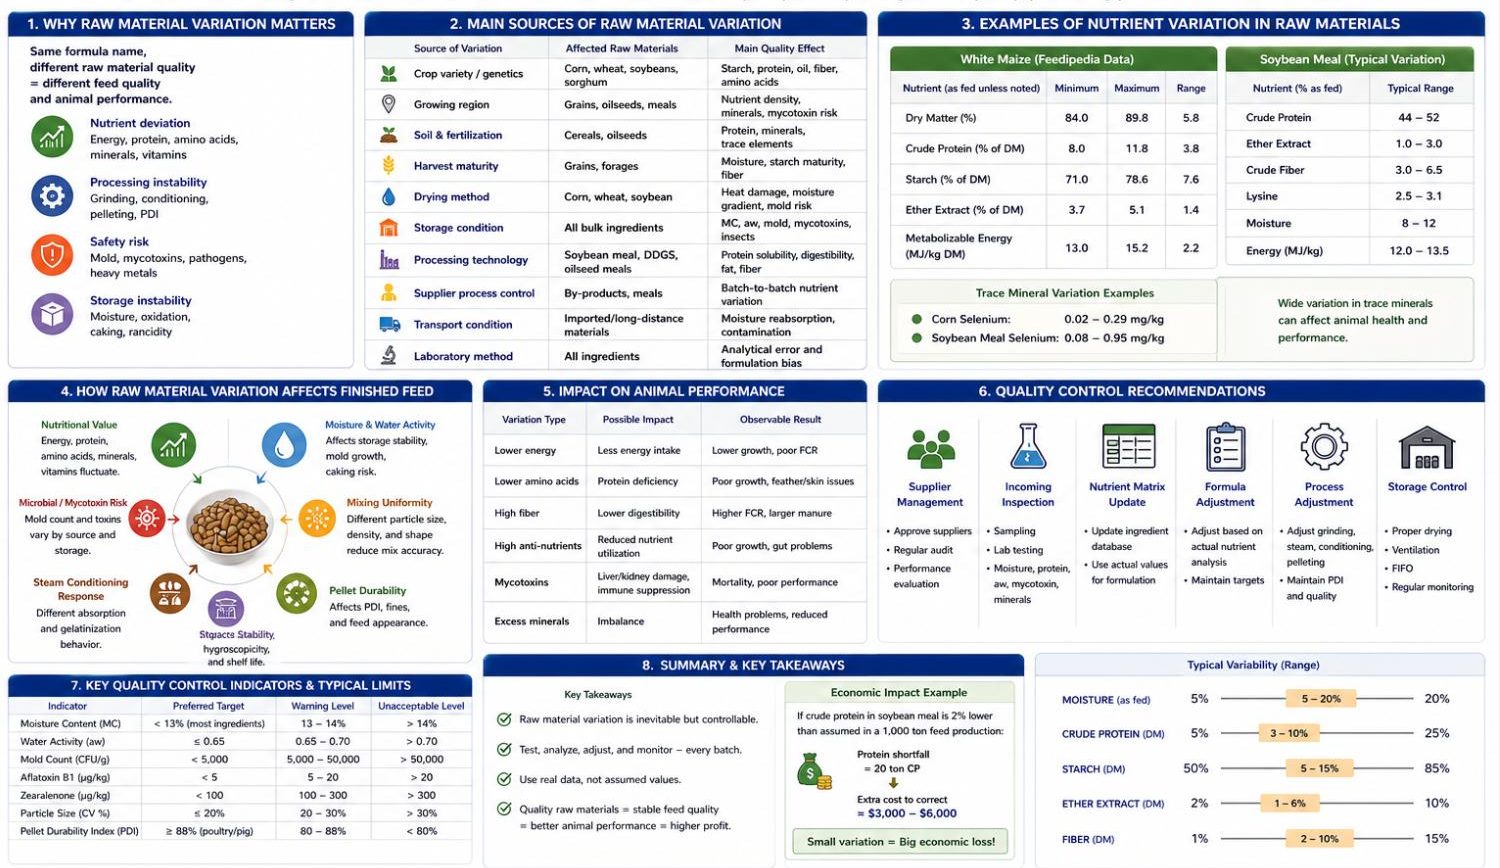
The main reason is that moisture content (MC) measures total water, while mold growth is governed primarily by water activity (aw), localized free water, environmental humidity, temperature, packaging permeability, microbial contamination level, and post-production moisture migration.
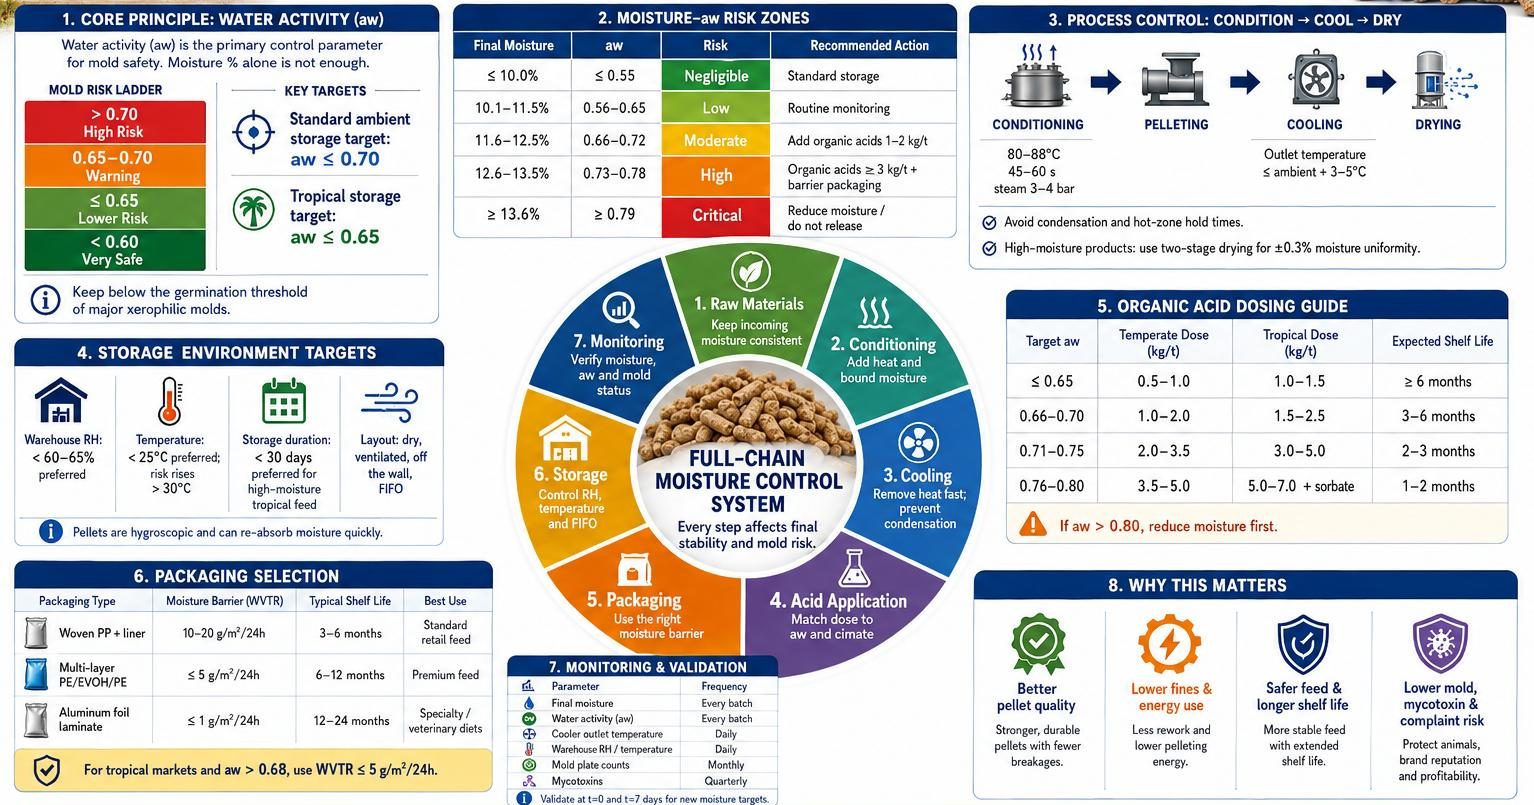
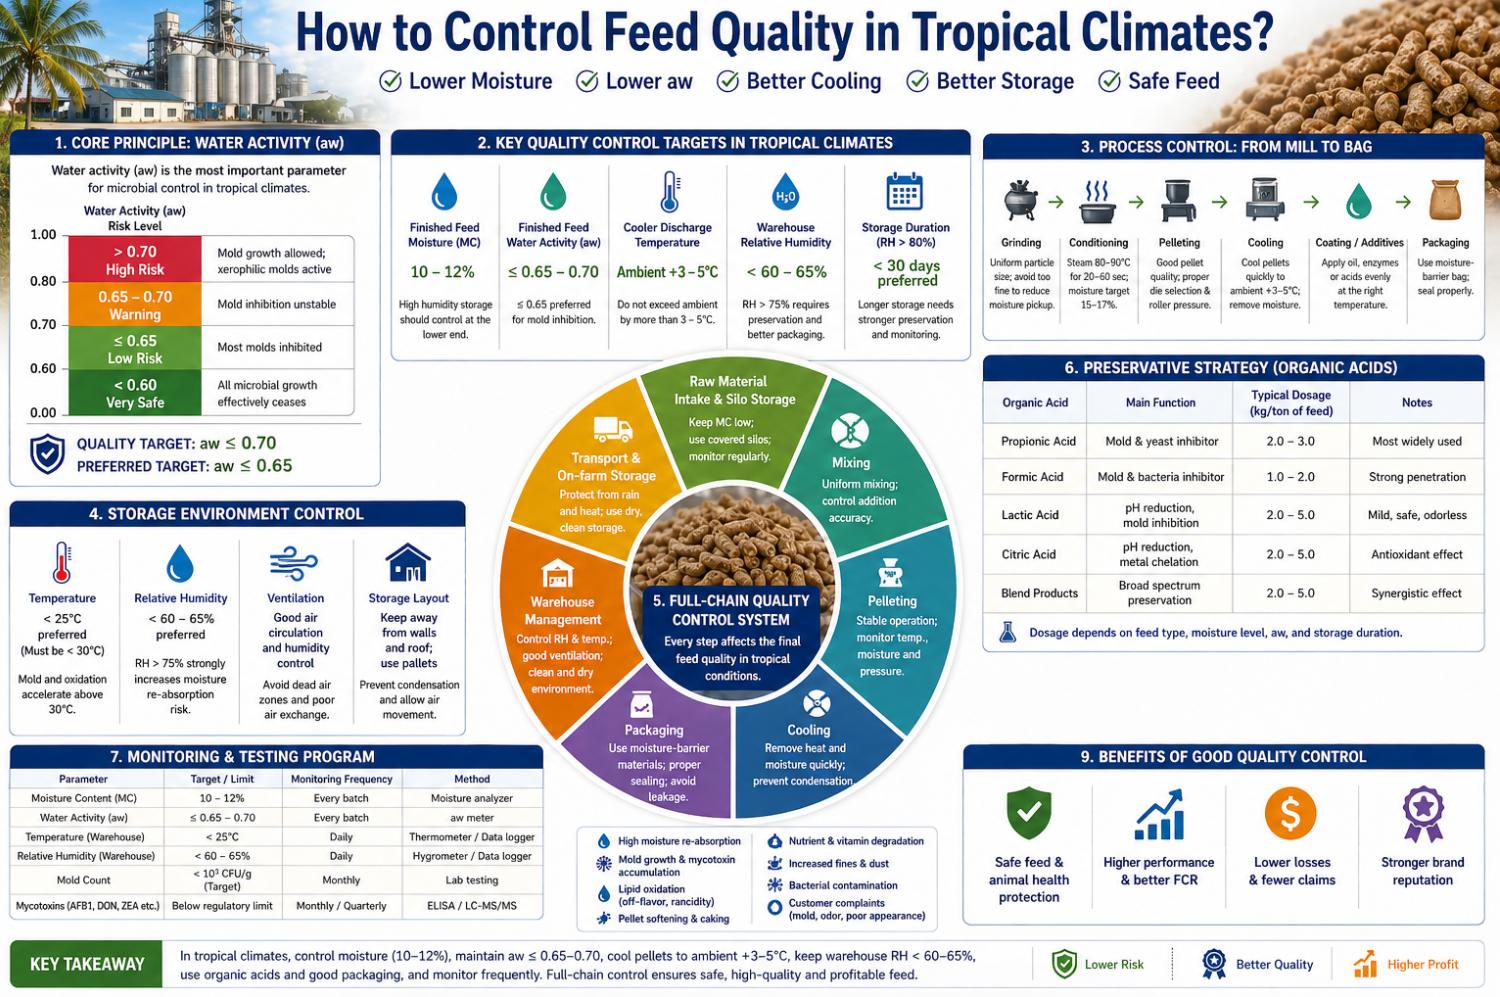
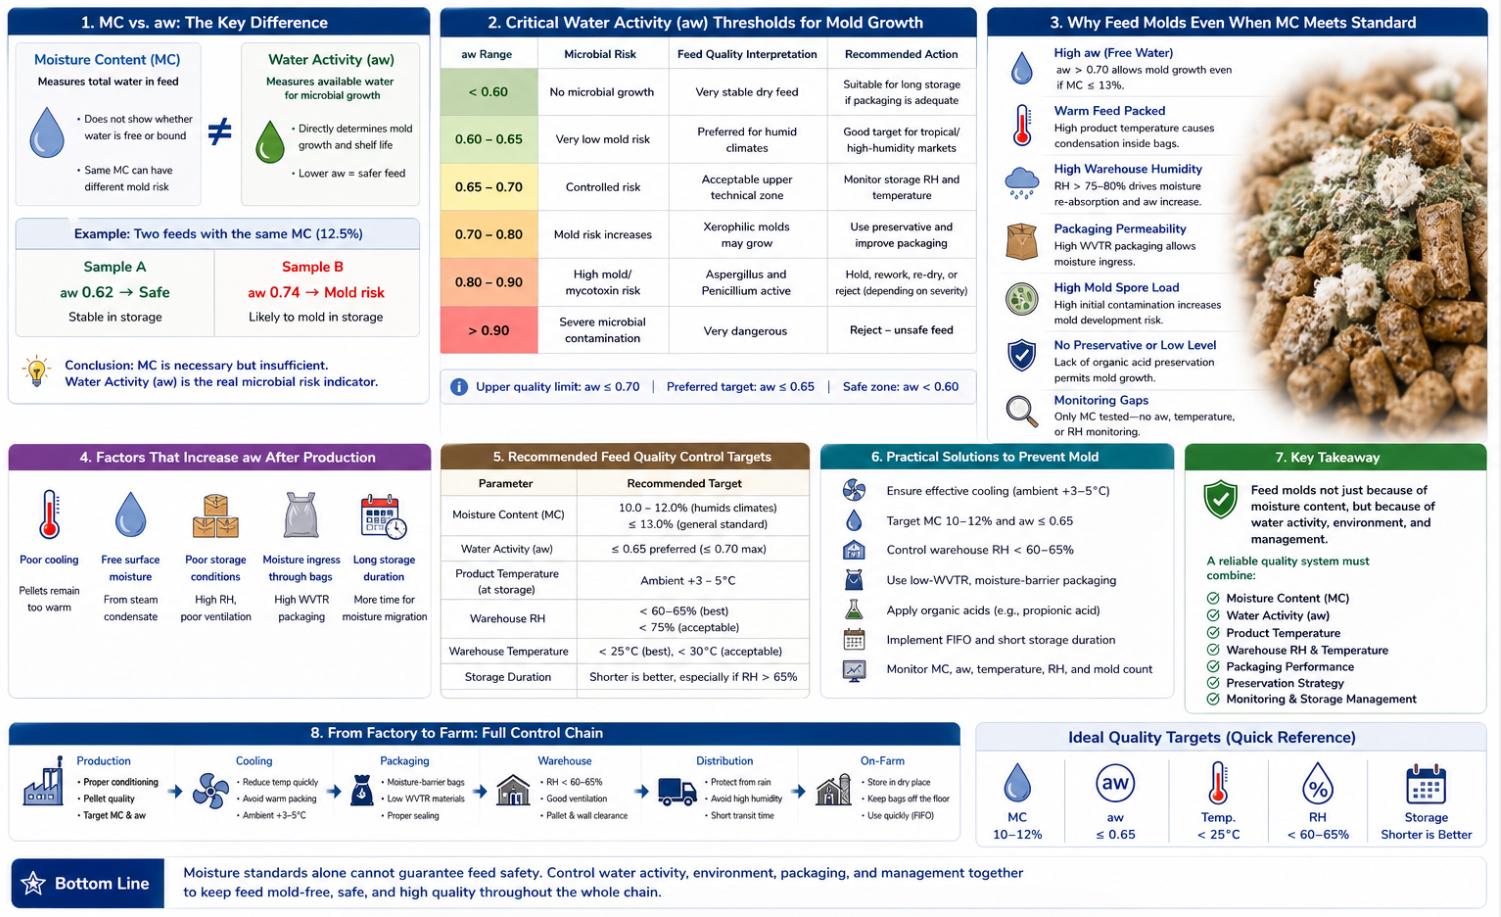
A batch of feed may pass the moisture standard at 12.0–13.0% MC, but if free surface water is present, if aw exceeds 0.70, if the feed is packed while still warm, or if the warehouse relative humidity remains above 75–80%, mold can grow during storage. Uploaded technical references identify aw ≤0.70 as the upper quality limit for finished feed, with aw ≤0.65 preferred for mold inhibition and aw <0.60 preventing essentially all microbial growth.
This report explains why moisture-compliant feed still molds, focusing on the technical difference between MC and aw, uneven moisture distribution, condensation, post-cooling temperature, packaging WVTR, warehouse humidity, mold spore load, organic acid preservation, and monitoring gaps. The conclusion is that finished feed should not be released based on MC alone.
A technically reliable quality control system must combine MC, aw, product temperature, cooling efficiency, packaging barrier, warehouse RH, mold count, and storage duration.
1- Introduction
In feed mill quality control, moisture content is one of the most frequently measured indicators. Many mills use a finished feed moisture standard such as ≤13.0%, or in some humid regions 10.5–12.5%. When a feed batch meets this standard, it is often considered safe for storage. However, practical production experience shows that feed can still become moldy even when laboratory moisture data are within the required range.
This is not a contradiction. It means that moisture content alone does not fully describe mold risk.
Mold growth depends on the amount of water available to microorganisms, not simply the total amount of water present in the feed. Water may exist as bound water inside the feed matrix or as free water on particle surfaces, inside cracks, between pellets, or in localized condensation zones. Bound water contributes less to microbial growth, while free water directly supports mold germination.
Therefore, the real technical question is not only:
“What is the feed moisture content?”
It should be:
“How much of this water is biologically available, where is it located, and what storage environment will the feed experience?”
This distinction is the key to understanding why feed molds even when moisture meets standard.
2- Moisture Content Is Not Equal to Microbial Safety
Moisture content measures the percentage of total water in a feed sample. It does not distinguish between bound water and free water. Water activity, or aw, measures the thermodynamic availability of water for microbial growth and chemical reactions.
Two feed samples may both test at 12.5% MC, but one may have aw 0.62 and remain stable, while the other may have aw 0.74 and become moldy. The difference may come from formula composition, particle structure, steam condensate, cooling conditions, packaging, or storage humidity.
The uploaded water-retention report explains that two feed samples with identical MC can behave differently because microbial risk depends on free versus bound water, and that effective moisture management aims to convert free surface water into bound, uniformly distributed moisture within the feed matrix.
Table 1. MC vs. aw: why moisture-compliant feed may still mold
| Parameter | What it measures | Typical QC use | Limitation |
|---|---|---|---|
| Moisture content, MC | Total water in feed | Finished feed release standard | Does not show whether water is free or bound |
| Water activity, aw | Available water for microbial growth | Mold and shelf-life risk control | Requires aw meter, not always measured |
| Surface moisture | Free water on pellet or powder surface | Often missed by bulk MC test | Can cause localized mold |
| Condensation water | Liquid water from temperature difference | Usually not present at release test | Appears after packaging/storage |
| Equilibrium moisture | Moisture exchange with ambient RH | Important for storage | Changes after feed leaves factory |
For mold prevention, MC is necessary but insufficient. aw is the more accurate biological risk indicator.
3- Critical aw Thresholds for Mold Growth
The most important reason feed molds despite meeting moisture standards is that the feed aw may still be high enough for mold growth. Many feed mills measure MC routinely but do not measure aw.
The uploaded mold-prevention report provides minimum aw values for major feed molds. Aspergillus flavus and Aspergillus parasiticus can grow at approximately aw 0.78, Aspergillus ochraceus around aw 0.77, Penicillium verrucosum around aw 0.80, Fusarium verticillioides around aw 0.87, and xerophilic molds can grow at aw as low as 0.61.
Table 2. Water activity thresholds and mold risk in finished feed
| aw range | Microbial risk | Feed quality interpretation | Recommended action |
|---|---|---|---|
| <0.60 | No microbial growth | Very stable dry feed | Suitable for long storage if packaging is adequate |
| 0.60–0.65 | Very low mold risk | Preferred for humid climates | Good target for tropical/high-humidity markets |
| 0.65–0.70 | Controlled risk | Acceptable upper technical zone | Monitor storage RH and temperature |
| 0.70–0.80 | Mold risk increases | Xerophilic molds may grow | Use preservative and improve packaging |
| 0.80–0.90 | High mold/mycotoxin risk | Aspergillus and Penicillium active | Hold, rework, re-dry, or reject depending on severity |
| >0.90 | Severe microbial risk | Bacteria and fast mold growth possible | Feed unsafe for storage |
The practical implication is clear: a feed batch may meet a moisture standard of ≤13%, but if aw is above 0.70, mold risk still exists. In humid markets, finished feed should preferably be controlled at aw ≤0.65, not merely MC ≤13%.
4- Cause 1: Water Is Unevenly Distributed Inside the Feed
A finished feed sample is not always uniform. Even if the average MC is within standard, localized zones may contain higher moisture. Mold normally begins in these localized wet areas.
Possible causes of uneven moisture include:
*- Wet steam during conditioning
*- Poor mixer water distribution
*- Excess liquid addition
*- Molasses or oil interfering with water absorption
*- Conditioner buildup dropping wet material into product
*- Non-uniform cooling
*- Condensation inside bags
*- Inconsistent particle size
*- Fine powder absorbing more water than pellets
Table 3. Average MC can hide localized high-moisture zones
| Feed condition | Average MC | Local condition | Mold risk |
|---|---|---|---|
| Uniform dry pellets | 12.0% | aw 0.62–0.65 | Low |
| Wet steam surface moisture | 12.0% | pellet surface aw >0.70 | Medium to high |
| Condensation inside bag | 12.0% at release | local wet zone after storage | High |
| Poorly cooled pellets | 12.5% | internal vapor migration | High |
| Powder-rich feed | 12.0% | fines absorb moisture faster | Medium to high |
| Wall-side warehouse stack | 12.0% | cooler wall-side condensation | High |
This is why a single laboratory MC result may not represent the true risk of the whole batch. For high-risk products, aw testing and multi-point sampling are necessary.
5- Cause 2: Feed Is Packed While Still Too Warm
One of the most common causes of mold in moisture-compliant feed is insufficient cooling. Pellets leave the pellet mill hot and moist. If they are bagged before cooling is complete, residual heat drives vapor migration inside the bag. As the feed cools, moisture condenses on cooler surfaces inside the package.
The feed may test at acceptable MC before bagging, but after packaging, condensation creates localized wet zones. These zones may support mold growth within days or weeks.
Uploaded shelf-life and mold-prevention reports show that pellets after conditioning and pelleting can be 75–95°C and carry high moisture, while post-cooling targets should reduce product temperature to approximately ambient +3–5°C and moisture to safe storage levels.
Table 4. Cooling-related mold risk
| Cooling parameter | Safe target | Warning level | Mold mechanism |
|---|---|---|---|
| Cooler outlet temperature | ambient +3–5°C | ambient +5–8°C | moderate condensation risk |
| Cooler outlet temperature | — | >ambient +10°C | high internal bag condensation risk |
| Finished feed MC, humid climate | 10.5–12.0% | >12.5% | insufficient storage safety margin |
| Finished feed aw | ≤0.65 preferred | >0.70 | mold growth possible |
| Cooling time | 10–15 min typical | too short | warm pellets enter bag/storage |
| Moisture loss in cooler | 1.0–3.0 points | too low | product remains too wet |
| Fines after cooler | <5–8% | >8–10% | fines absorb moisture rapidly |
The key technical point is that feed temperature at bagging is as important as feed moisture. A batch that meets MC standard but is stored at ambient +10°C can still mold because of condensation.
6- Cause 3: Warehouse RH Is Too High
Feed continues to exchange moisture with its environment after packaging. If warehouse relative humidity is higher than the feed’s equilibrium humidity, the feed absorbs moisture. Standard packaging does not fully prevent this.
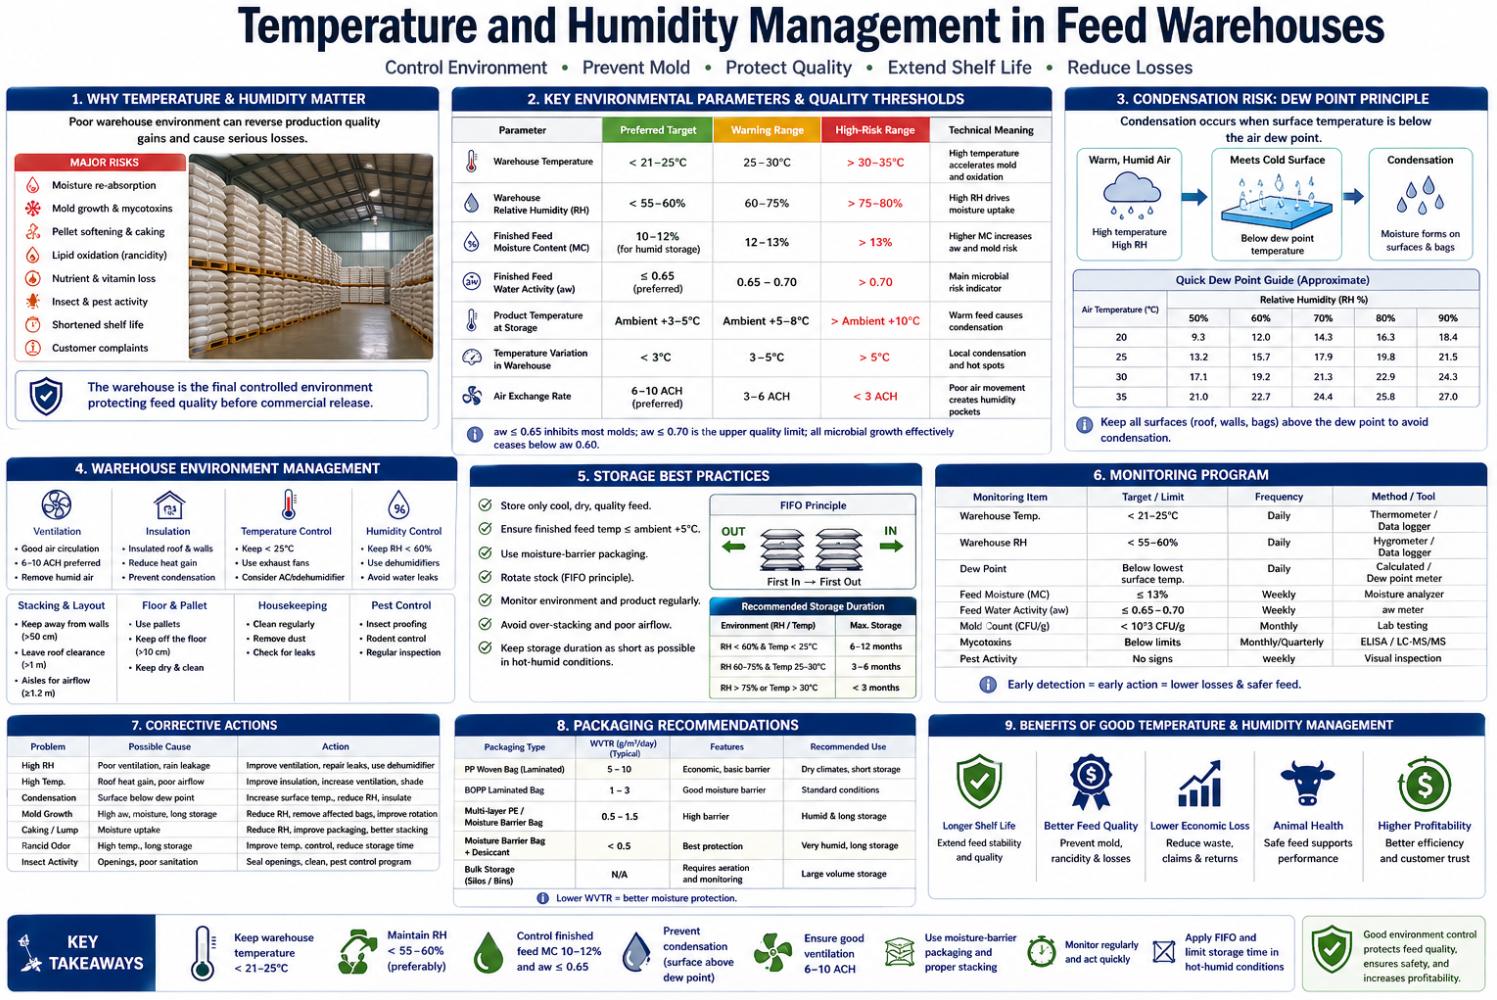
This is especially serious in tropical climates, rainy seasons, coastal areas, and poorly ventilated warehouses. The uploaded mold-prevention report classifies RH above 75% as a high-risk condition and recommends warehouse RH below 55–60% where possible.
Table 5. Warehouse RH and feed mold risk
| Warehouse RH | Risk level | Expected feed behavior | Recommended control |
|---|---|---|---|
| <50% | Low | Feed remains dry or loses slight moisture | Standard storage |
| 50–60% | Preferred | Stable storage | Suitable for normal shelf life |
| 60–65% | Acceptable with control | Slow moisture uptake possible | Monitor aw |
| 65–75% | Moderate risk | Moisture absorption increases | Use better packaging/FIFO |
| 75–85% | High risk | Mold risk rises, especially with warm feed | Use acid preservative and barrier bags |
| >85% | Very high risk | Condensation and rapid spoilage possible | Avoid long storage |
A moisture-compliant feed stored in RH 80–90% may absorb enough moisture through packaging or damaged seams to raise local aw above the mold threshold. Therefore, warehouse conditions can make a compliant product become non-compliant after release.
7- Cause 4: Packaging Allows Moisture Ingress
Packaging material determines how quickly humid air affects feed. Standard woven polypropylene bags are economical but have relatively high water vapor transmission. In humid climates or long storage, moisture may enter the bag even if feed was dry at production.
The uploaded mold-prevention report gives packaging WVTR values: standard woven PP may have WVTR of 30–80 g/m²/day, woven PP with PE liner around 10–30 g/m²/day, laminated BOPP/PE around 3–10 g/m²/day, PE/aluminum laminate below 1 g/m²/day, and MAP barrier film below 0.5 g/m²/day.
Table 6. Packaging permeability and mold risk
| Packaging type | WVTR | Mold risk in humid storage | Recommended use |
|---|---|---|---|
| Woven PP | 30–80 g/m²/day | High for long humid storage | Short-term, low-humidity markets |
| Woven PP + PE liner | 10–30 g/m²/day | Moderate | 1–2 months in moderate humidity |
| Laminated BOPP/PE | 3–10 g/m²/day | Lower | Commercial feed in humid markets |
| PE/Al foil laminate | <1 g/m²/day | Very low | Premium/export/specialty feed |
| MAP barrier film | <0.5 g/m²/day | Very low | High-value, long shelf-life feed |
| Paper + PE + Al foil | <0.1 g/m²/day | Minimum moisture ingress | Premix/vitamin concentrate |
If a feed mill uses low-barrier packaging in a high-RH market, feed may mold even when the factory moisture result is acceptable. The moisture standard was met at production, but packaging did not maintain the standard during storage.
8- Cause 5: Product Temperature and Air Dew Point Create Condensation
Condensation occurs when humid air contacts a surface colder than its dew point. In feed warehouses, condensation may form on walls, floors, roofs, container interiors, and bag surfaces. Feed near these wet surfaces may mold first.
Common situations include:
*- Bags placed against cool walls
*- Bags stored directly on concrete floor
*- Warm feed loaded into a cooler container
*- Feed stored under metal roofs with night cooling
*- Rainy-season warehouse doors opened frequently
*- Temperature difference between day and night exceeding 5°C
*- Poor airflow behind stacks
Table 7. Condensation-related mold patterns
| Mold location | Likely cause | Technical explanation | Corrective action |
|---|---|---|---|
| Mold on inner bag surface | Feed packed too warm | internal vapor condensation | improve cooling to ambient +3–5°C |
| Mold on wall-side bags | wall condensation | cold wall below dew point | keep 30–50 cm wall clearance |
| Mold on bottom layer | floor moisture | concrete moisture absorption | use pallets 10–15 cm high |
| Mold near roof area | roof dripping | metal roof condensation/leak | improve insulation and sealing |
| Mold in container shipment | container rain | warm humid air condenses | use container desiccants and dry loading |
| Mold only in corner stacks | dead-air zone | localized high RH | improve circulation and spacing |
Condensation is dangerous because it produces localized free water. Even a small amount of liquid water can raise local aw to a level suitable for mold growth.
9- Cause 6: Mold Spore Load Is Already High
Mold growth depends not only on water and temperature but also on contamination pressure. If raw materials, cooler residues, conveyors, bins, or packaging materials contain high mold spore loads, feed may mold faster even at borderline-safe aw.
Sources of mold contamination include:
*- Moldy raw materials
*- Corn, DDGS, rice bran, groundnut meal, cottonseed meal, or fish meal with high microbial load
*- Dirty cooler interior
*- Dust accumulation in conveyors and elevators
*- Residual fines in bins
*- Old feed residues in bagging equipment
*- Contaminated pallets
*- Humid packaging storage areas
The uploaded mold-prevention report recommends microbiological monitoring and gives general acceptance criteria: total mold count below 1,000 CFU/g is acceptable, 1,000–10,000 CFU/g is alert level, and above 10,000 CFU/g is reject level.
Table 8. Mold count interpretation for finished feed
| Indicator | Acceptable | Alert level | Reject level |
|---|---|---|---|
| Total mold count | <1,000 CFU/g | 1,000–10,000 CFU/g | >10,000 CFU/g |
| Aspergillus spp. | <100 CFU/g | 100–500 CFU/g | >500 CFU/g |
| Fusarium spp. | <100 CFU/g | 100–1,000 CFU/g | >1,000 CFU/g |
| Penicillium spp. | <500 CFU/g | 500–5,000 CFU/g | >5,000 CFU/g |
| Total aerobic count | <50,000 CFU/g | 50,000–200,000 CFU/g | >200,000 CFU/g |
If mold count is high at release, the product has a short safety margin. Even if MC meets the standard, small increases in aw during storage can trigger rapid growth.

10- Cause 7: Formula Composition Raises aw or Mold Sensitivity
Different feed formulas bind water differently. This means the same MC can produce different aw values depending on ingredients.
High-risk formula characteristics include:
*- High starch and damaged starch content
*- High sugar or molasses inclusion
*- High-fat materials prone to oxidation
*- Hygroscopic minerals or salts
*- High-protein meals with variable moisture
*- DDGS, rice bran, wheat bran, and other by-products
*- Fish meal and animal protein meals
*- Fine powder fraction with high surface area
*- Organic acids or salts affecting equilibrium moisture
Table 9. Formula-related reasons MC standard may fail to predict mold
| Formula factor | Effect on feed stability | Mold relevance |
|---|---|---|
| Molasses 2–5% | Hygroscopic and yeast-sensitive | May increase caking and fermentation |
| High fine powder | High surface area | Absorbs moisture faster |
| High fat >4% | Oxidation risk | Rancidity plus mold complaints |
| DDGS / bran | Variable moisture and fiber | Uneven water binding |
| Fish meal | microbial and oxidation risk | requires low moisture and antioxidant |
| Hygroscopic minerals | absorb environmental moisture | local wet spots |
| High pellet fines | more surface area | higher moisture uptake |
A universal moisture standard does not fully account for formula-specific aw behavior. A feed mill should build formula-specific MC-aw relationships.
11- Cause 8: Preservative Dose Is Too Low or Uneven
Organic acid preservatives can inhibit mold, but only if the correct active ingredient, dosage, and distribution are used. Feed may mold despite meeting MC standard if preservative was absent, under-dosed, poorly mixed, degraded, or unsuitable for the target organism.
The uploaded mold-prevention report provides practical propionic acid rates from 0.05–0.30% depending on moisture and storage risk. It also notes that multi-acid blends may provide broader protection than single-acid systems under high-risk conditions.
Table 10. Preservative strategy by mold risk
| Storage condition | Finished feed condition | Recommended preservative strategy |
|---|---|---|
| Low risk, RH <60% | MC ≤13%, aw ≤0.70 | optional 0.05–0.10% propionic acid |
| Moderate risk, RH 60–75% | MC 11–12%, aw ≤0.68 | 0.10–0.15% propionic acid |
| High risk, RH 75–85% | MC 10–11.5%, aw ≤0.65 | 0.15–0.25% multi-acid blend |
| Very high risk, RH >85% | MC ≤10.5%, aw ≤0.62–0.65 | 0.20–0.30% multi-acid blend |
| Yeast-sensitive feed | molasses or sugar present | include sorbic/acetic acid |
| High-fat feed | oxidation risk | preservative + antioxidant |
Preservatives reduce risk; they do not make wet feed safe. If aw is already above 0.80, the correct action is usually re-drying, rapid use, or rejection, not simply adding more acid.
12- Cause 9: Sampling and Testing Do Not Represent the Whole Batch
Feed may pass moisture testing because the sample does not represent the full batch. This is especially common when moisture distribution is uneven.
Sampling errors include:
*- Taking only one surface sample
*- Sampling immediately after cooling but not after equilibration
*- Ignoring bag bottom layers
*- Not sampling wall-side or corner stacks
*- Not testing after transport
*- Testing MC but not aw
*- Using uncalibrated moisture meters
*- Using oven drying methods affected by volatile compounds
Table 11. Sampling points for mold-risk diagnosis
| Sampling point | Purpose |
|---|---|
| Post-cooler discharge | confirms production moisture and temperature |
| After bagging | checks packaging-stage condition |
| 24 h after storage | detects moisture equilibration |
| Bottom pallet layer | checks floor moisture risk |
| Wall-side stacks | checks condensation risk |
| Warehouse corner stacks | checks dead-air zone risk |
| Returned customer bags | confirms field condition |
| High-risk raw materials | identifies contamination source |
For mold complaints, the correct investigation should compare retained factory samples, warehouse samples, and customer-returned samples. This helps determine whether mold originated from production, storage, transport, or customer handling.
13- Diagnostic Matrix: Why Feed Molds Although MC Meets Standard
Table 12. Root cause diagnosis
| Observation | MC result | Likely cause | Confirm by | Corrective action |
|---|---|---|---|---|
| MC ≤13%, aw >0.70 | compliant MC | high free water | aw meter | improve drying/cooling and water binding |
| Mold inside bag | compliant at release | internal condensation | product temp record | reduce cooler outlet temp |
| Mold on wall-side bags | compliant | warehouse condensation | RH/dew point check | improve spacing and airflow |
| Mold only after 30–45 days | compliant | packaging moisture ingress | WVTR and RH records | upgrade bag and reduce shelf life |
| Mold in rainy season only | compliant | high ambient RH | warehouse datalogger | seasonal preservative and packaging |
| Mold in high-fat feed | compliant | oxidation plus moisture risk | PV/AV and aw | antioxidant + barrier packaging |
| Mold in powder/fines | compliant | high surface area | fines/PDI test | improve pellet durability |
| Mold in some bags only | compliant | localized wet spots | multi-point sampling | improve sampling and stacking |
| Mold appears quickly | compliant | high initial mold load | mold count | raw material and hygiene control |
| Mold after transport | compliant | container condensation | container RH/temperature | dry loading and desiccants |
This table shows that “moisture meets standard” only eliminates one possible cause. It does not eliminate aw, condensation, packaging, storage, microbial load, or distribution risk.
14- Recommended Quality Control System
To prevent mold in moisture-compliant feed, mills should build a multi-parameter release system.
Table 13. Recommended release criteria for finished feed
| Parameter | Normal climate target | Humid/tropical target | Action limit |
|---|---|---|---|
| Finished MC | ≤13.0% | 10.5–12.0% | >13.0% hold |
| Finished aw | ≤0.70 | ≤0.65 preferred | >0.70 hold/rework |
| Cooler outlet temperature | ambient +3–5°C | ambient +3–5°C | >ambient +8–10°C hold |
| PDI | 85–92% depending feed | 88–92% for poultry/pig | <85% investigate |
| Fines after cooling | <5–8% | <5–8% | >8–10% investigate |
| Total mold count | <1,000 CFU/g | <1,000 CFU/g | >10,000 CFU/g reject |
| Warehouse RH | <60% | <65% practical target | >75% high risk |
| Preservative | risk-based | 0.15–0.25% blend in high RH | verify dosage |
| Packaging WVTR | risk-based | <10 or <5 g/m²/day | poor barrier not suitable |
The essential upgrade is adding aw to QC. For feeds shipped to humid markets, MC testing without aw testing is incomplete.
15- Corrective Actions by Process Stage
Table 14. Process-based corrective action plan
| Process stage | Mold-risk cause | Corrective action |
|---|---|---|
| Raw material intake | high MC, mold spores, mycotoxins | test MC, aw, mold count, mycotoxins |
| Storage silo | condensation and hot spots | aeration, FIFO, temperature monitoring |
| Grinding | high fines and heat | control particle size and product temperature |
| Mixing | uneven water addition | use atomized water/MDS, verify mixing |
| Conditioning | wet steam/free surface water | improve steam separator and condensate drainage |
| Pelleting | high friction or weak pellets | adjust die, moisture, and PDI control |
| Cooling | warm pellets and condensation | cool to ambient +3–5°C |
| Bagging | warm feed packed too soon | hold feed until temperature safe |
| Packaging | high WVTR | use PE liner, laminated bag, or barrier film |
| Warehouse | high RH and poor airflow | dehumidify, ventilate correctly, use pallets |
| Transport | container rain | use dry container, desiccant, liner |
| Farm storage | open bags and humidity | provide storage instructions and shelf-life limit |
16- Example Case: Feed Meets 12.5% MC Standard but Molds After 40 Days
A feed mill produces broiler feed with a finished moisture standard of ≤13%. Laboratory results show 12.5% MC, so the batch is released. After 40 days in a distributor warehouse, mold appears inside bags.
Table 15. Investigation data
| Parameter | Result | Recommended value | Diagnosis |
|---|---|---|---|
| Finished MC at release | 12.5% | ≤13.0% | Meets normal MC standard |
| Finished aw at release | 0.72 | ≤0.65–0.70 | Too high for storage |
| Cooler outlet temperature | ambient +9°C | ambient +3–5°C | Under-cooled |
| Warehouse RH | 78–85% | <65% preferred | High humidity |
| Packaging | woven PP | laminated/PE liner in high RH | Too permeable |
| Preservative | none | 0.15–0.25% acid blend | No mold inhibition |
| Mold count at release | 3,500 CFU/g | <1,000 CFU/g preferred | Already alert level |
| Storage duration | 40 days | risk-dependent | Too long for current control system |
Table 16. Technical conclusion from case
| Finding | Interpretation |
|---|---|
| MC was acceptable | MC standard alone was insufficient |
| aw was above safe target | Free water was available for mold |
| feed was packed warm | condensation likely occurred |
| warehouse RH was high | moisture ingress occurred |
| packaging had poor barrier | humidity entered bag |
| mold count was elevated | contamination pressure was high |
Corrective action
1- Keep finished MC at 10.8–11.8% for high-RH markets.
2- Add finished feed aw release limit: ≤0.65 preferred, ≤0.70 maximum.
3- Cool pellets to ambient +3–5°C before bagging.
4- Upgrade packaging from woven PP to PE-lined or laminated bag.
5- Use 0.15–0.25% multi-acid preservative during rainy season.
6- Require warehouse RH monitoring and FIFO storage.
7- Test mold count on high-risk batches.
17- Economic Impact
Mold in moisture-compliant feed is especially costly because the product has already passed normal QC and entered commercial distribution. Losses include product return, disposal, transport, compensation, customer trust loss, and possible animal performance problems.
Table 17. Example economic loss from mold complaints
| Annual feed production | Mold complaint / spoilage rate | Affected feed | Feed value at USD 350/t | Direct feed value at risk |
|---|---|---|---|---|
| 50,000 t/year | 1% | 500 t | USD 350/t | USD 175,000 |
| 100,000 t/year | 1% | 1,000 t | USD 350/t | USD 350,000 |
| 150,000 t/year | 2% | 3,000 t | USD 350/t | USD 1,050,000 |
| 300,000 t/year | 2% | 6,000 t | USD 350/t | USD 2,100,000 |
These figures exclude secondary losses from brand damage, animal health claims, laboratory testing, and mycotoxin-related disputes.
18- Regulatory and Documentation Considerations
Feed mills should document mold risk control as part of feed safety management. The uploaded moisture-control report notes that moisture and aw measurements, calibration records, control limits, corrective actions, and verification records are expected components of feed safety management and audit systems.
Recommended documentation includes:
*- Finished feed MC records
*- Finished feed aw records
*- Cooler outlet temperature records
*- Warehouse temperature/RH datalogger records
*- Packaging WVTR specifications
*- Preservative dosage records
*- Mold count records
*- Mycotoxin test records for high-risk materials
*- Customer complaint traceability records
*- Corrective action records
For humid markets, the feed label or delivery document should specify storage conditions, such as: store in a cool, dry, ventilated place; avoid direct floor contact; use within declared shelf life after opening; and keep away from rain and condensation.
19- Final Technical Conclusions
Feed can mold even when moisture meets standard because moisture content is not the only determinant of mold growth. MC measures total water, while mold responds to available water, local condensation, storage humidity, temperature, contamination level, packaging permeability, and storage duration.
The major conclusions are:
1- Moisture content alone is insufficient for mold risk control. Finished feed should be controlled by both MC and aw.
2- aw ≤0.70 should be treated as the maximum quality limit, while aw ≤0.65 is preferred for humid climates, tropical storage, and longer shelf life.
3- A feed with MC ≤13% can still mold if aw is above 0.70, if moisture is unevenly distributed, or if free surface water is present.
4- Poor cooling is a major cause. Feed should not enter bags or warehouse storage until it reaches approximately ambient +3–5°C.
5- High warehouse RH can make feed absorb moisture after production. RH above 75% is a high-risk condition, especially when packaging has poor vapor barrier performance.
6- Packaging matters. Standard woven PP bags are often insufficient for long storage in humid markets because their water vapor transmission rate is high.
7- Localized condensation can cause mold even when the average batch moisture is normal. Wall-side bags, bottom layers, roof areas, and containers are common risk zones.
8- High mold spore load shortens shelf life. Raw material hygiene, cooler cleaning, conveyor sanitation, and packaging storage must be controlled.
9- Organic acid preservatives are useful but must be dosed according to aw, MC, RH, storage duration, and mold risk. They cannot fully compensate for severely wet or poorly stored feed.
10- Quality control should include MC, aw, product temperature, mold count, warehouse RH, packaging WVTR, preservative dose, and storage duration.
In conclusion, the correct answer to “Why does feed mold even when moisture meets standard?” is that the moisture standard measures only total water at one point in time, while mold risk is controlled by available water and the complete storage environment. A modern feed mill should therefore replace moisture-only release control with a multi-parameter mold prevention system based on aw, cooling temperature, packaging barrier, warehouse humidity, microbial monitoring, and traceable storage management.